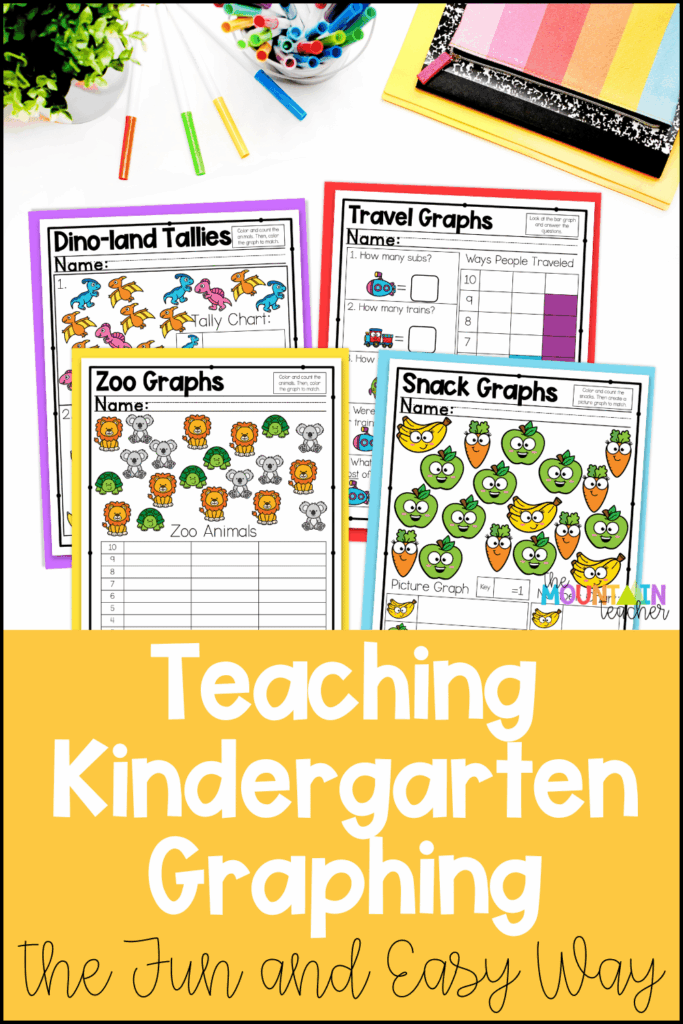
Teaching graphing and data in kindergarten is one of those sneaky topics that seems simple… until you actually start teaching it. Suddenly, you realize, Wait… we’re counting, sorting, comparing, interpreting, AND building visual models… all at once?! It’s a lot! But don’t worry, friends, bar graphs and picture graphs don’t have to be overwhelming for our littlest learners (or you!). With the right visuals, hands-on practice, and a clear teaching sequence, students can quickly learn how to sort objects, organize data, and answer questions about what they see. Come along to learn how you can get started teaching kindergarten graphing without the drama!
Why Bar Graphs & Picture Graphs Can Be Tricky for Little Learners
Before we dive into all the tips, let’s first chat about where you’re probably getting hung up. Graphing looks simple… but for a 5-year-old, it’s actually a lot of thinking steps at once. Our students are learning to:

- Classify objects into categories
- Count accurately
- Represent each count in a new format
- Understand that height on the graph = quantity
- Use data to answer questions
I mean, no wonder this feels so BIG! Some students may sort correctly but lose track while counting. Others may count perfectly but struggle to show it on a graph. And some may look at a completed graph and freeze because interpreting data is also a brand-new skill.
It sounds like a lot, but with the right approach, your students will be graphing and data analyzing pros. I’ve got a tried and true, streamlined resource that will make it simple and fun to teach graphing and data. Trust me, this is going to be a total game-changer in your teaching!
Kindergarten Graphing Made Easy
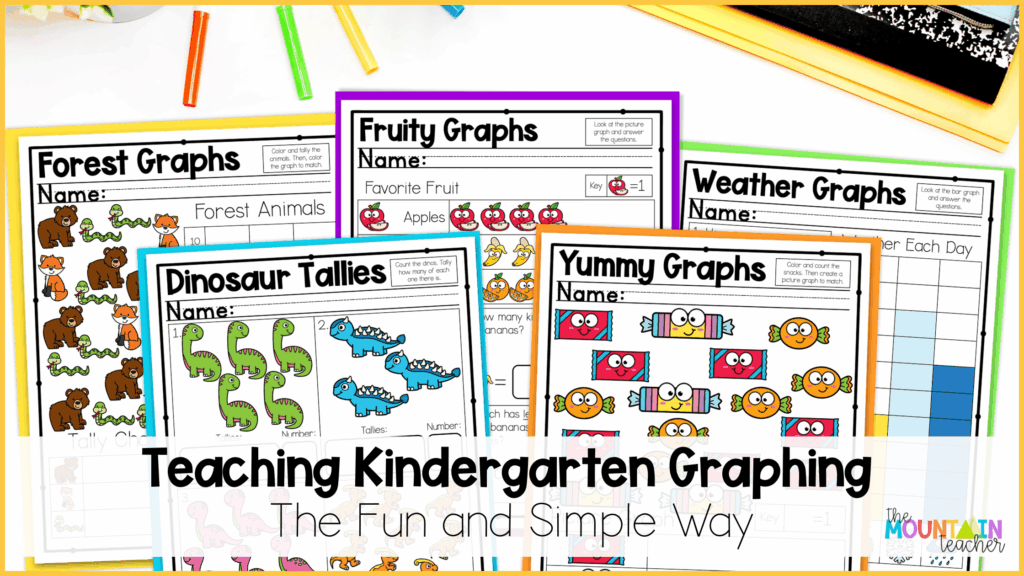
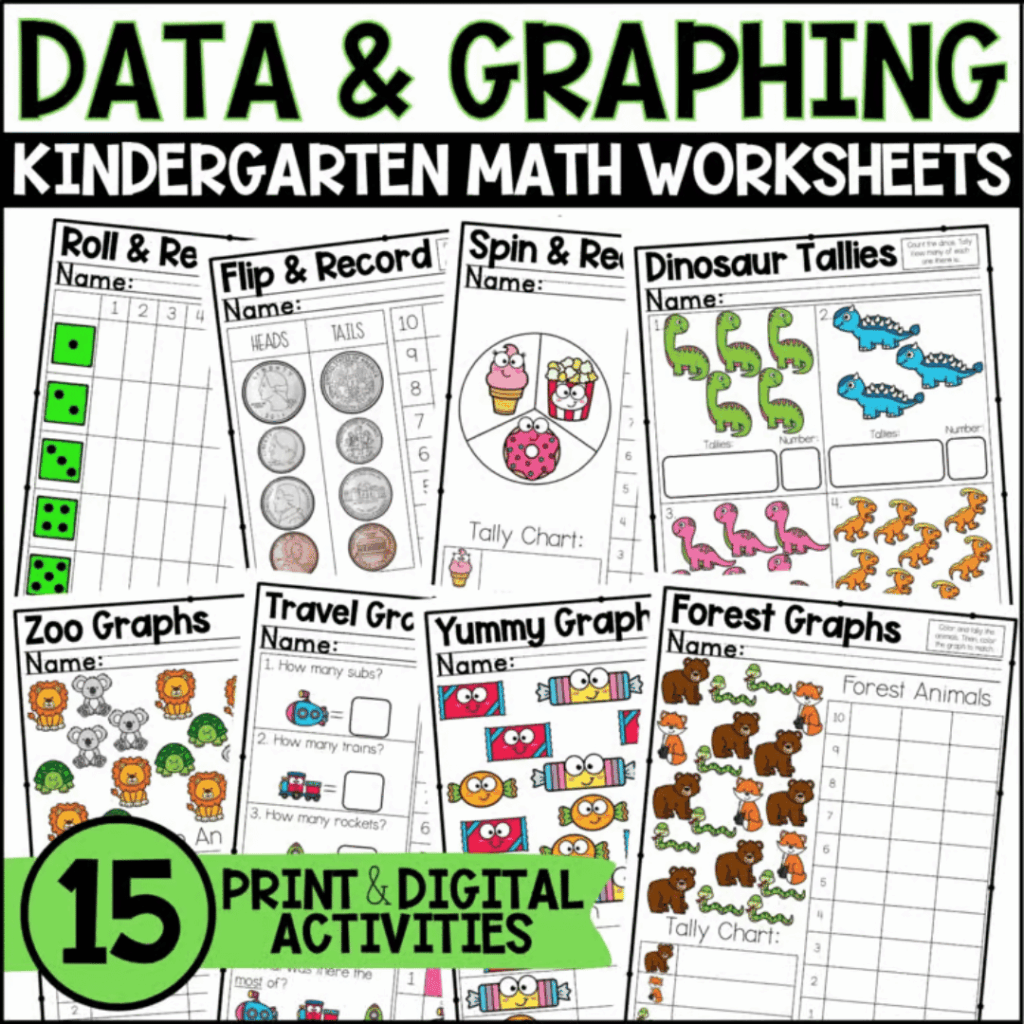
To take away the planning stress and make this concept simple to teach, I created my Kindergarten Graphing Unit, which includes everything you need for a full three weeks of lessons. Inside this unit, you’ll find:

- A 15-day teaching guide
- 15 days of no-prep graphing worksheets & activities
- Anchor Charts
- A short post-test
- Answer keys
It’s super simple to use! You’ll open up your teaching guide, find the day you’re working on, and follow along. Each day has a focus skill, lesson, or teaching suggestion as well as practice pages and hands-on learning opportunities. And don’t worry, the practice pages aren’t just fluff! Each page reinforces a key skill in the order students need it, which takes away the guesswork for you.
The worksheets are intentionally simple, visual, and hands-on. Students cut and sort, count and color, draw pictures, build bars, and answer basic questions. Everything is aligned to kindergarten math standards, too, so you know you’re covering exactly what kindergarteners need.
Let’s take a look at exactly how I use the materials inside to make teaching kindergarten graphing easy and fun!
Step One: Start With Strong Visual Anchor Charts
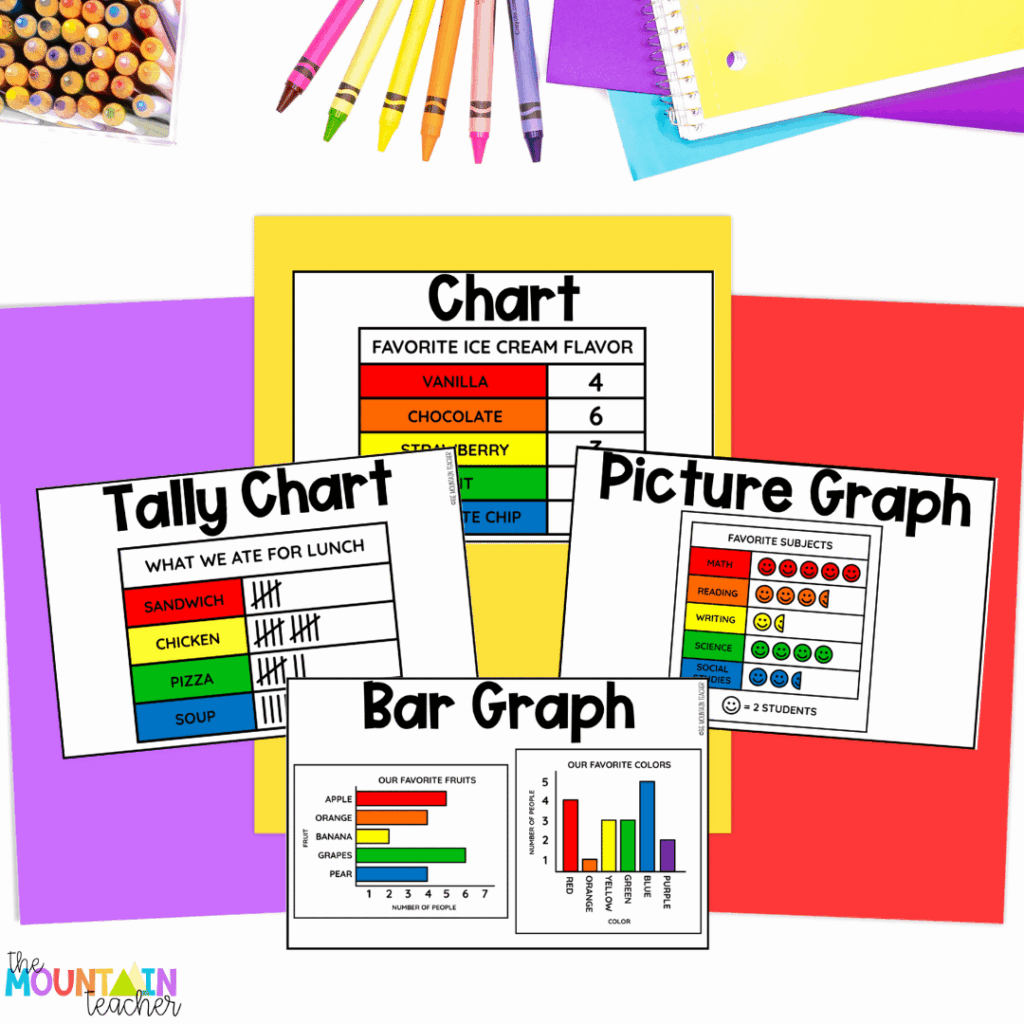
Just like with any abstract math idea, anchor charts make all the difference! For graphing, clear visuals help students understand the purpose of each chart type. I like to introduce anchor charts one at a time and model how each one works. Here are the charts we use in my Kindergarten Graphing Unit.
- Tally Chart: Shows marks grouped by fives
- Sorting Chart: Helps organize objects into categories
- Bar Graph: Shows data with rectangular “bars”
- Picture Graph: Represents data with pictures or symbols
Instead of just showing the charts, I use them in teaching. We use them as an example and a way to explain how data is shown in that particular graph, and then we get to work making our own graphs.
How to Introduce Each Anchor Chart and Type of Graph
My favorite way to introduce new graphs is by graphing real classroom objects like markers, blocks, or glue sticks. I also love making group graphs that allow students to share their favorite snack choices, colors, or even what kind of shoes they’re wearing that day.
Prepare for Your Kindergarten Graphing Intro
To start, I use a large piece of chart paper and build out the graphing template I need. You can do this quickly and easily with a black marker. Just draw your lines, add category names depending on the type of graph you want to make, and you’re ready to go! Just be sure to do this ahead of time so you can jump right into your lesson.
If you want to reuse the chart, create the graph format, but leave off the title and categories. Laminate the chart so you can use it over and over again with a dry-erase marker.
Get Graphing!
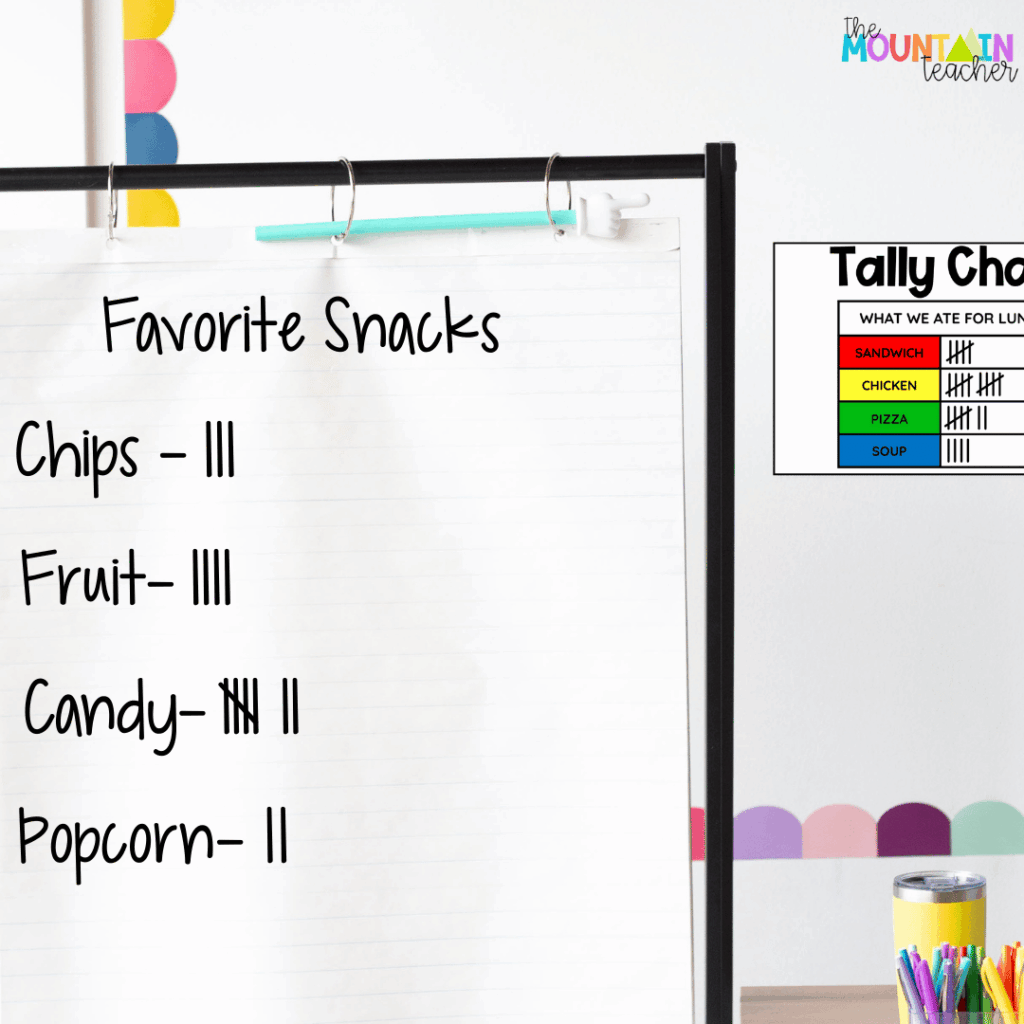
When we first start with graphing, I introduce the concept by saying something like, “A graph is a picture that helps us see ‘how many.’ For example, we can make a graph to show our favorite snacks.” I hold up the anchor chart for the graph we’re learning about that day and talk about what it shows.
Then, I jump right into demonstrating this by showing the kids how we add data to the graph one at a time to represent each object/choice. In the example of snacks, I might start by sharing my favorite snack and then adding it to the graph. Then I’d ask kids one at a time to tell me their favorite snack from the choices on my graph and add theirs. We keep repeating until every child is called.
Analyze the Data
Afterwards, we can analyze the graph together. I ask questions like which category has the most, or least, and how the students know. We repeat this process each time we learn about a new type of graph. This opportunity to model and interact with each new type of graph is super important before moving on to the practice pages!
These anchor charts and our classroom graphs stay posted all month long, and I also laminate small versions for math centers. Students reference them constantly during graphing activities!
Step Two: Hands-On Learning for Kindergarten Graphing

After the initial introduction, it’s time to dive into some hands-on learning opportunities for kindergarten graphing. This is the MOST important tip, so listen up!
Before students ever fill in a graph on paper independently, they need the chance to touch the data. Trust me, this is SO important when it comes to making this concept stick. So plan on PLENTY of hands-on learning to ensure your kids get what they need to succeed here!
Here are some of our go-to hands-on graphing activities that are a big hit:
- Sort classroom manipulatives (buttons, cubes, animals, shapes) into categories
- Collect class data as a group (Check step one for an example of how to do this. You can make group graphs about favorite colors, animals, how we go home, etc.)
- Use linking cubes to build bar graphs vertically
- Use picture cards to create picture graphs on pocket charts
- Use tally sticks and sort them into categories on the carpet
- Seasonal mini erasers for sorting, counting, and comparing
Hands-on exploration helps students understand that graphs are not just pictures; they REPRESENT real information! Make sure you weave in simple activities like these during small groups, centers, morning tubs, and whole group learning. Once that connection is solid, worksheets make MUCH more sense!
Step Three: Choose Engaging Graphing Practice That Builds Understanding
Alright, now we’re ready for practice pages. But not just any practice pages, these need to be fun and age-appropriate! I don’t know about you, but I’ve definitely come across my fair share of graphing activities that are a bit too complicated. That’s why I created some simple yet effective worksheets to get the job done!
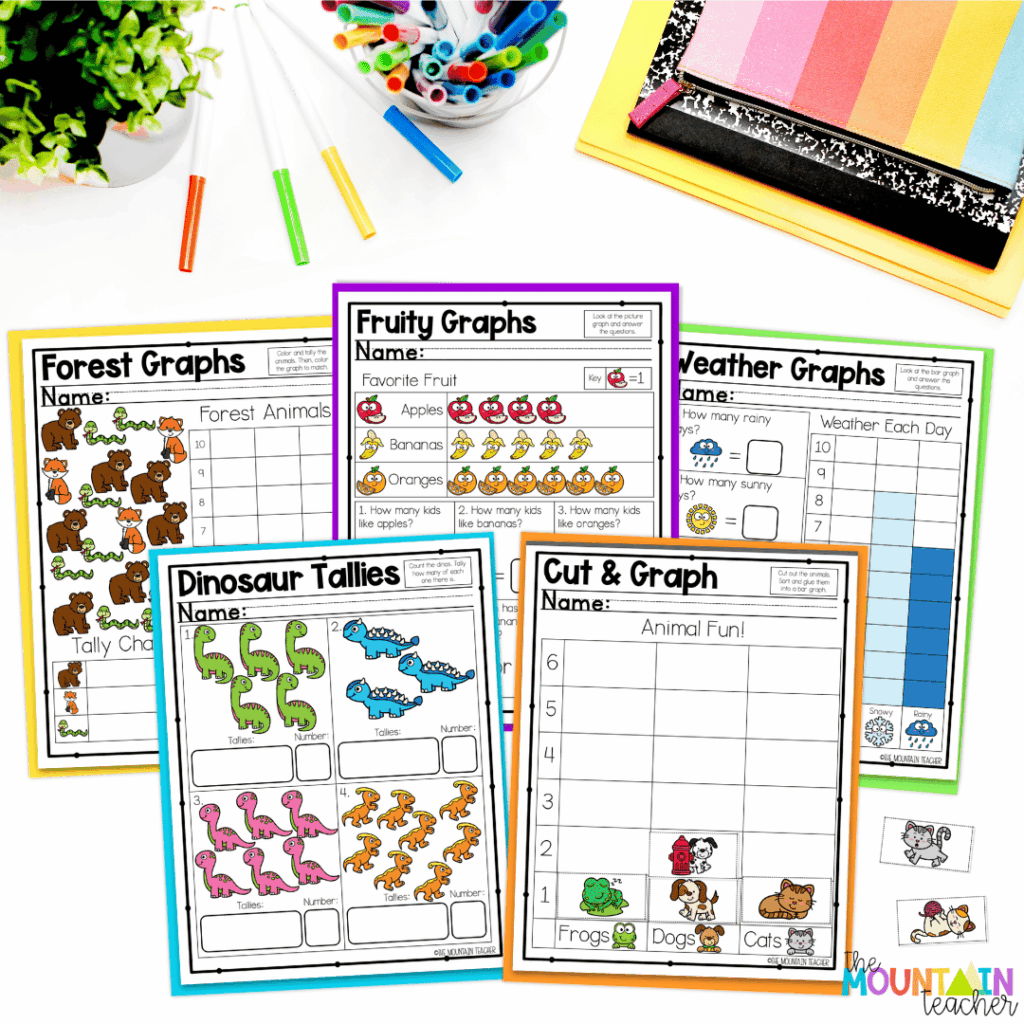
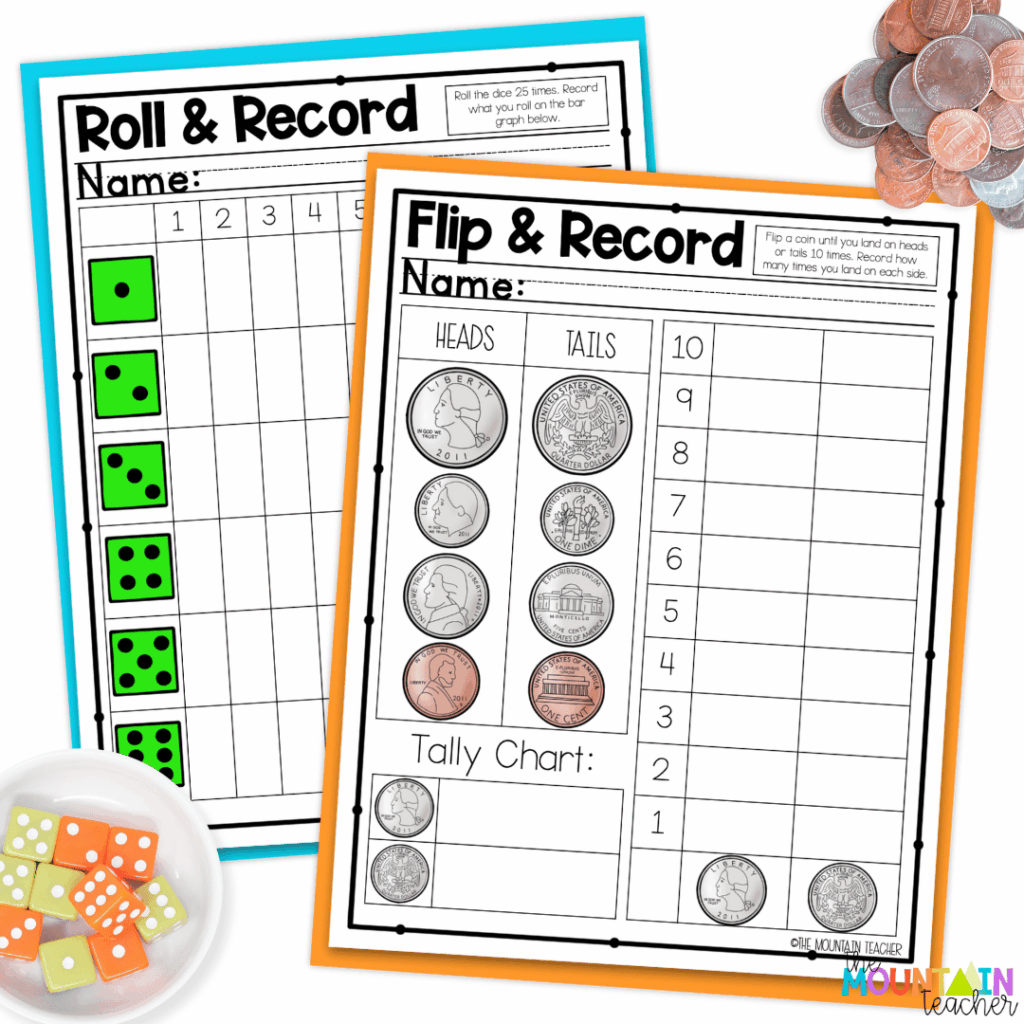
Inside my Kindergarten Graphing Unit, you get worksheets for each daily lesson that target a specific skill. Students will learn to work with tally marks and charts, bar graphs, picture graphs, and analyze data in a kindergarten-friendly way!
The worksheets are fun, too! Students will cut and glue pictures, draw pictures to show quantities, count and compare categories, cut and sort, and more. These no-prep activities will help give your kids the practice they need with these key skills, without the overwhelm.
How to Put These Kindergarten Graphing Ideas Together
Wondering how to structure your kindergarten graphing lessons? A short, consistent routine is the secret sauce! Here’s the structure we use in our math block:
1. Warm-Up
First, do some quick counting practice with a simple question like:
“Which has more, markers or pencils?” You can use anything you have on hand, and it will get those brains fired up for more!
2. Mini Lesson
Introduce ONE skill using an anchor chart or real objects. Remember, inside the Kindergarten Graphing Unit, you get a daily plan that will tell exactly what to focus on. You won’t have to worry about the sequence of teaching – hooray!
3. Guided Practice
After your mini lesson, have students sort objects, build a simple graph, or help fill one in, depending on what you taught. This is where you can use one of the hands-on learning activities mentioned in step two.
4. Independent Practice
Finally, students should complete the worksheet aligned to today’s skill. The teaching guides tell you exactly which one to pair with your lesson! I like to do this in small groups so I can observe my kids and make sure everyone is getting it. If not, we slow down and reteach the next day as many times as needed!
This routine keeps things predictable and focused, so students make progress quickly without feeling overwhelmed. Plus, it will help you give each group what they need. You can adjust your pacing for each group and give the support that each one needs to be successful with kindergarten graphing skills.
Make Planning Simple with the Kindergarten Graphing Unit
Alright friends, are you seeing this Kindergarten Graphing Unit coming to life?! This approach has served me so well over the years and helped my kids become total graphing experts. Honestly, there’s nothing better than that!
If you want to streamline your planning and skip the guesswork, you need this unit in your life. Head on over to TPT to grab yours and make kindergarten graphing lessons a breeze! You’ll go from stressed to impressed and actually look forward to teaching this skill in your room!
Want All Your Math Lessons to Feel This Simple?
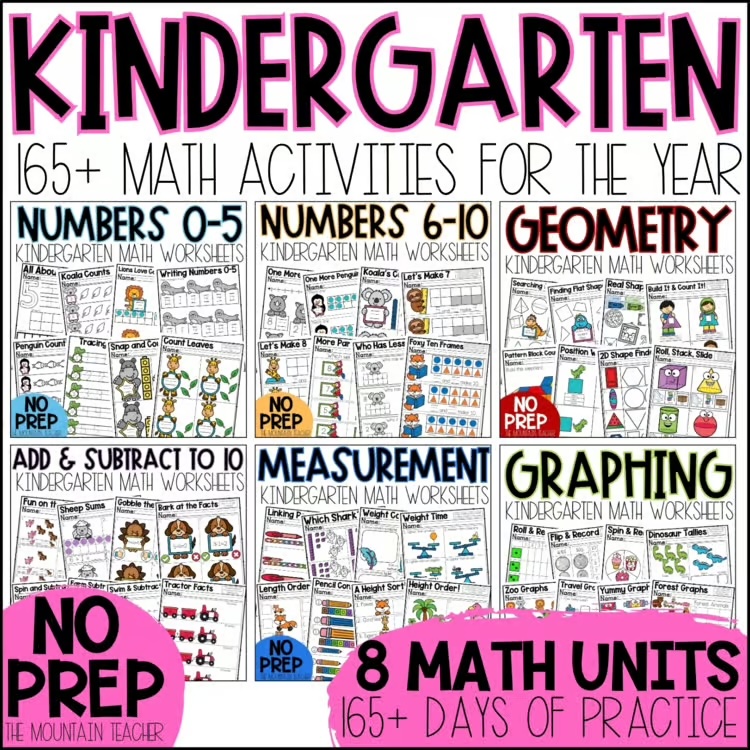
If you love the structure and clarity of the Graphing Unit, you’ll definitely want to check out the Year-Long Kindergarten Math Bundle. Inside, you get 8 full math units that will simplify your lesson planning and allow you to breathe easy knowing they’re standards-aligned. Just like the graphing unit, the bundle includes:
- Daily teaching guides for every unit
- Anchor charts for visual support
- Hands-on, no-prep activities
- Post Assessments
- Answer keys
- Daily sequences that remove the guesswork
It’s everything you need to confidently teach math all year long, without reinventing the wheel every week. Imagine how much time you’ll save!!
If you’re ready for easy prep, consistent routines, and FUN standards-aligned lessons, the bundle will be your new best friend! Head to TPT to grab your copy and kick your feet up because math is PLANNED!
Looking for More?
Be sure to check out these Kindergarten Math Posts next!
- The Best Numbers to 5 Activities for Kindergarten
- 5 Fun & Easy Ways to Teach Numbers 0-10 in Kindergarten
Save This Post
Make sure to pin this post on Pinterest so that you can come back to it when you’re ready to teach kindergarten graphing in your classroom.