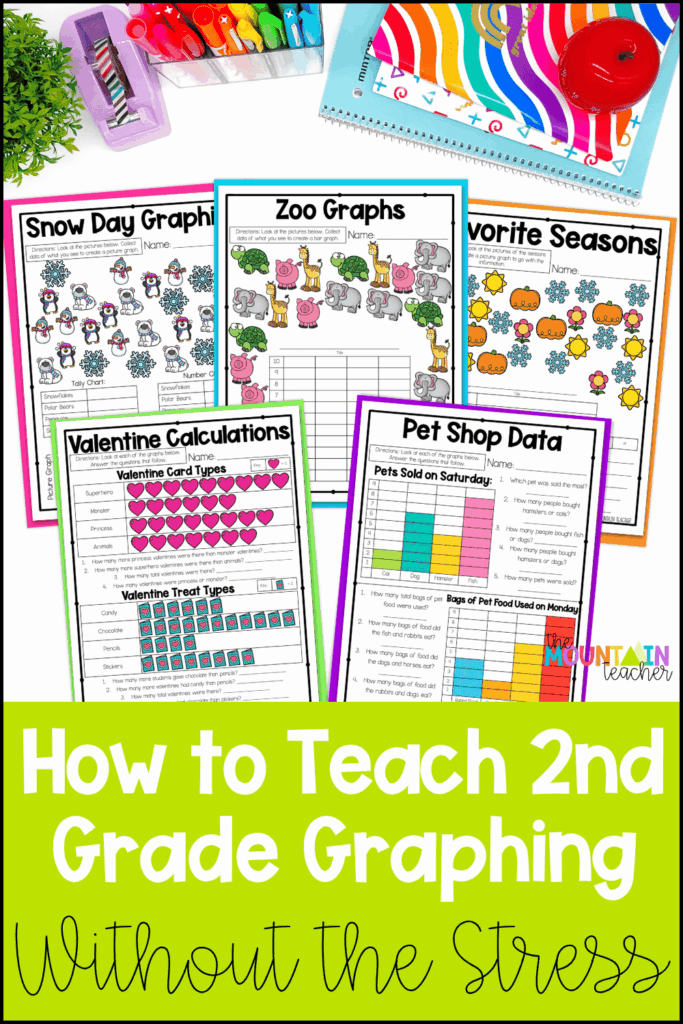
Have you ever reached your 2nd grade graphing unit and realized you’ve got a few worksheets, maybe a survey activity, and not much else? You’re definitely not alone. Graphing is one of those math topics that often gets squeezed into the end of a grading period, leaving teachers scrambling to piece together lessons that actually make sense.
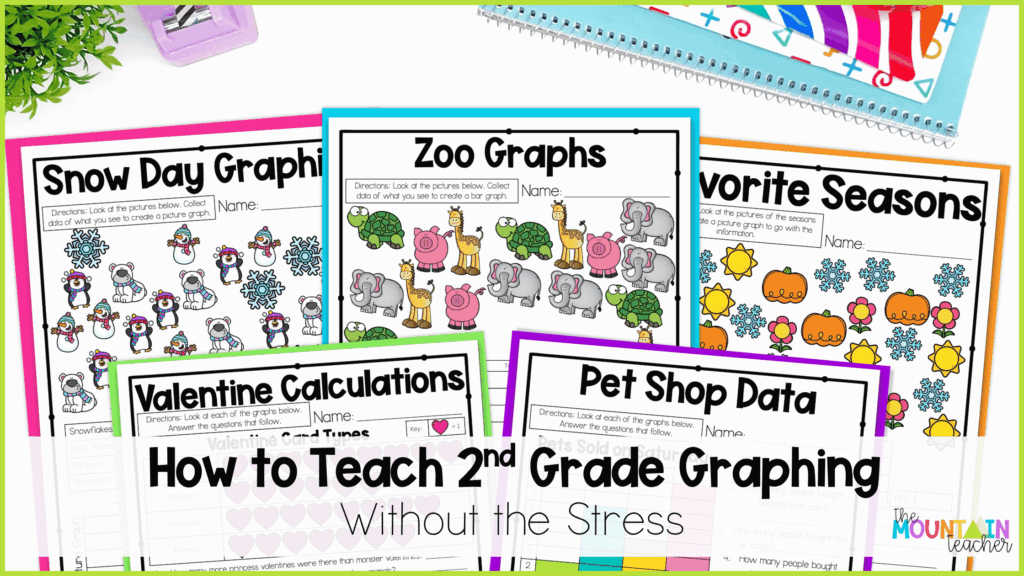
The good news is that teaching graphing in 2nd grade doesn’t have to feel rushed or disconnected. When students learn how data is collected, organized, displayed, and interpreted in a logical order, graphing becomes one of the most engaging parts of your math block. Let’s look at how to plan a graphing unit that builds understanding and keeps students excited from start to finish.
Why 2nd Grade Graphing Can Feel Tricky to Teach
Graphing isn’t just about coloring bars on a graph. Students are expected to collect information, organize it, represent it accurately, and then use that information to solve problems. That’s a lot of different skills packed into one unit!
Many students can create a graph but struggle when it’s time to answer questions about the data. Others can identify the tallest bar but aren’t sure how to compare categories or determine how many more or fewer. Without a clear progression, graphing can quickly become confusing. The key is helping students understand that graphs tell a story. Before they can analyze data, they need to understand where the data came from and what it represents.
Let’s walk through some key teaching tips for 2nd grade graphing, as well as how you can use my tried and true resource that makes it super simple to pull together!
Start with Class Led Data Collection
One of the biggest mistakes teachers make is jumping straight into completed graphs. Before students ever create a bar graph or picture graph, spend time helping them collect and organize information. This gives purpose to the graphs they’ll create later.
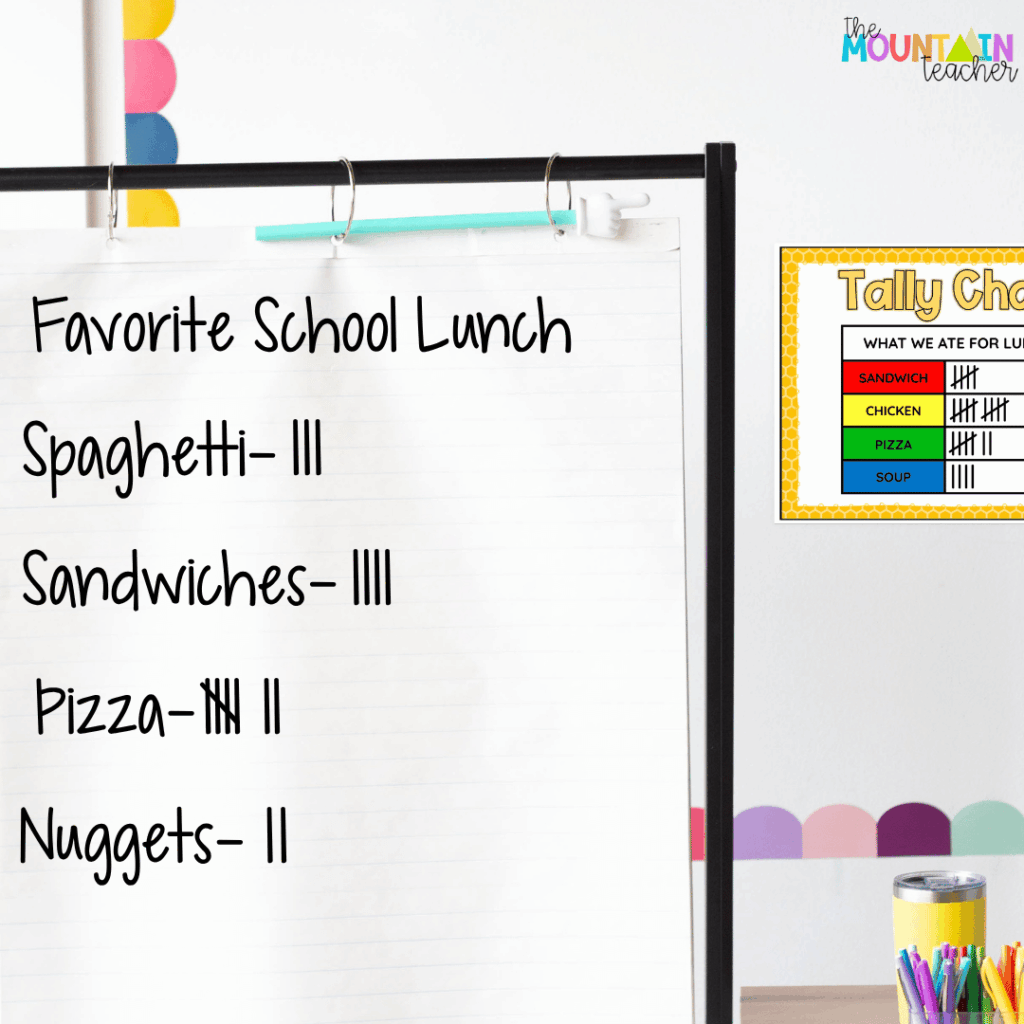
For example, you might survey the class about favorite recess activities, favorite books, or favorite school lunches. As students answer, model how to record the information carefully.
You could say: “Each time someone chooses soccer, I’m adding one tally mark. Watch how I organize my tallies so I can count them easily later.”
This simple step helps students see that graphs aren’t random pictures. They’re visual representations of real information.
In my room, I love to start my 2nd grade graphing lessons by collecting and organizing data in this format before moving into graph creation. This helps them understand the entire process instead of simply filling in boxes on a worksheet.
Move Into Picture Graphs
Once students understand where data comes from, it’s time to introduce picture graphs. Picture graphs are often easier for students because they can visually connect each symbol to a quantity. This creates an excellent bridge between tally charts and more advanced graphing concepts.
A simple classroom example might look like this. . . You survey the class about favorite pets and discover:
- 8 students chose dogs
- 5 students chose cats
- 3 students chose fish
Students can then use pictures to represent each category and begin discussing what the graph shows. As you model, ask questions such as, Which category has the most/fewest?, or How many more students chose dogs than fish?.
These conversations help students move beyond creating graphs and start thinking about interpreting them.
Introduce Bar Graphs and Graph Keys
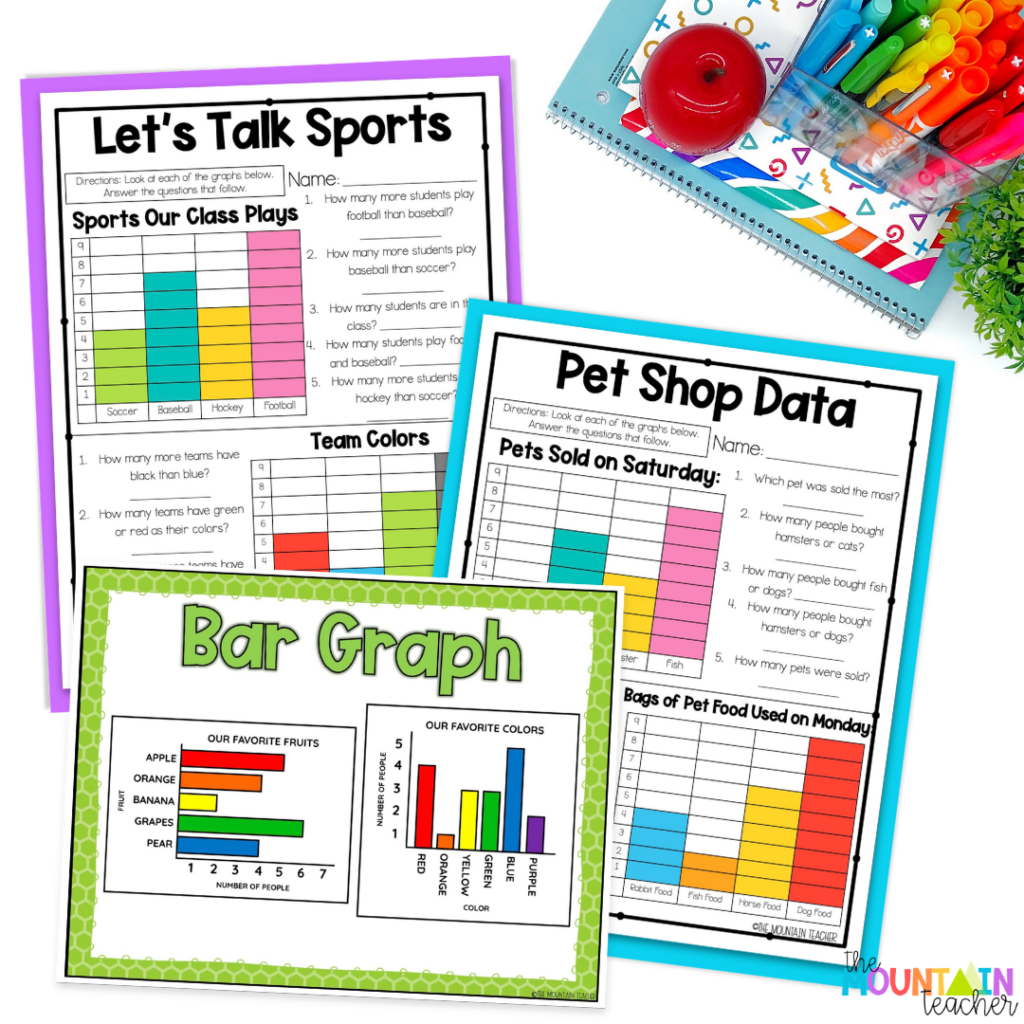
After students are comfortable with picture graphs, bar graphs become much easier to understand. This is also the perfect time to introduce graph keys. Many students can read a graph when each picture represents one item. Things become more challenging when each symbol represents two or five items. That’s why I like to teach graph keys gradually.
First, use a key where each symbol or interval equals one item. Then move to keys that represent two items. Finally, introduce graphs where each symbol or interval represents a value of five. For example, if one picture represents five students, ask: “If we see three pictures, does that mean three students or fifteen students?” This is a great time to practice skip counting as you point to one symbol or interval.
These discussions help students develop the reasoning skills they’ll need throughout the unit. The worksheets in my 2nd Grade Graphing Unit include opportunities to work with graph keys equal to 1, 2, and 5, so students gain confidence with multiple graph formats.
Teach Students How to Analyze Graphs
Creating graphs is only half the standard. Students also need practice answering questions and solving problems using the information displayed on a graph. This is where modeling becomes incredibly important.
Instead of immediately asking students to solve independently, think aloud as you work through questions together.
For example: “I’m looking for which category has the most. First, I’ll compare the bars. The tallest bar represents soccer, so soccer has the most votes.”
Then move to comparison questions: “Basketball has 12 votes, and soccer has 18. Let’s figure out how many more votes soccer received.”
This type of guided thinking helps students learn how to approach graphing questions independently in the future.
Use Visual Supports Throughout Your 2nd Grade Graphing Unit
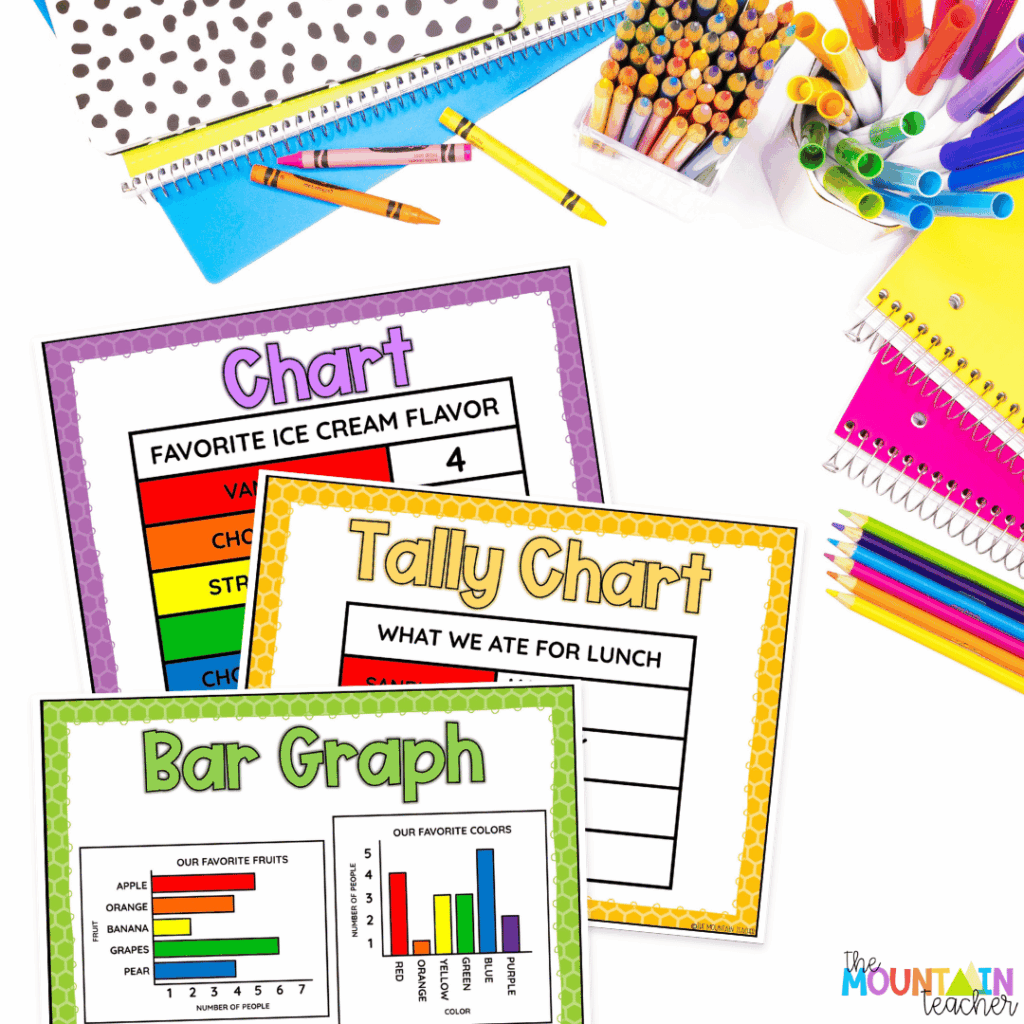
One of the easiest ways to help graphing concepts stick is by keeping visuals visible throughout the entire unit. Anchor charts give students a reference point when they forget vocabulary or need help remembering how a graph works. In my 2nd Grade Graphing Unit, you’ll find teaching guides and visual supports that help students understand:
- Collecting and organizing data
- Reading picture graphs
- Reading bar graphs
- Using graph keys
- Solving graphing word problems
When students can refer back to visuals, they become much more independent during practice.
Don’t Skip the Assessments
Assessments aren’t just for grades. They’re valuable teaching tools. A pre-assessment helps you identify what students already understand before the unit begins. You may discover that students can read simple graphs but struggle with comparison questions.
As the unit progresses, practice assessments help you identify areas that need additional instruction before moving forward. The 2nd Grade Graphing Unit includes both a practice test and a post-test so you can easily monitor growth throughout the unit.
A Simple Daily Routine for Teaching Graphing
If you’re wondering how to fit graphing into your math block, keeping a consistent routine can make a huge difference. A simple structure might look like this:
Warm-Up
Review a previously learned graph and ask a few quick interpretation questions.
Mini Lesson
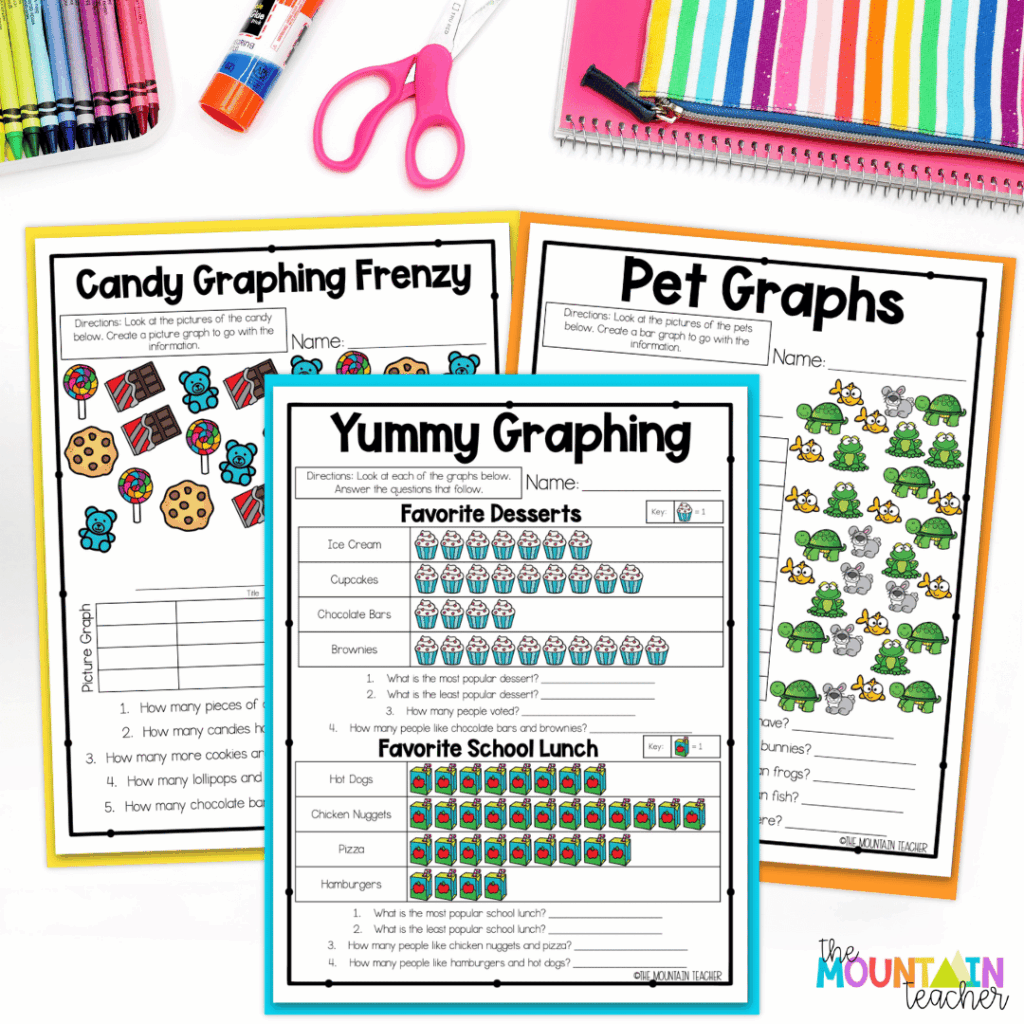
Introduce the new skill in a mini lesson. This is a great time to pull in some anchor charts or visuals like the ones in my 2nd Grade Graphing Unit to help make new concepts more concrete.
Guided Practice
Create or analyze a graph together as a class. You can collect data from students in your room, or use a pre-built graph to analyze.
Independent Practice
Complete a corresponding worksheet or digital activity to practice and apply what you just taught.
Reflection
Discuss strategies and compare answers. This is my favorite part because I can quickly and easily see who needs more support!
This predictable routine helps students focus on the content rather than trying to figure out what’s expected each day.
Make Planning Your 2nd Grade Graphing Unit Easy
If you’ve ever found yourself scrambling to pull together graphing lessons, this resource was designed to solve that problem. The 2nd Grade Graphing Unit walks students through graphing step by step, so concepts build naturally over time.
Inside you’ll find:
- 13 graphing worksheets covering bar graphs and picture graphs
- A complete teaching guide
- 2 graphing assessments
- 3 homework assignments
- Answer keys
- Printable activities
- Google Slides workbook
- Easel activities
Students learn how to collect data, create graphs, interpret information, and solve graphing word problems while building confidence every step of the way.
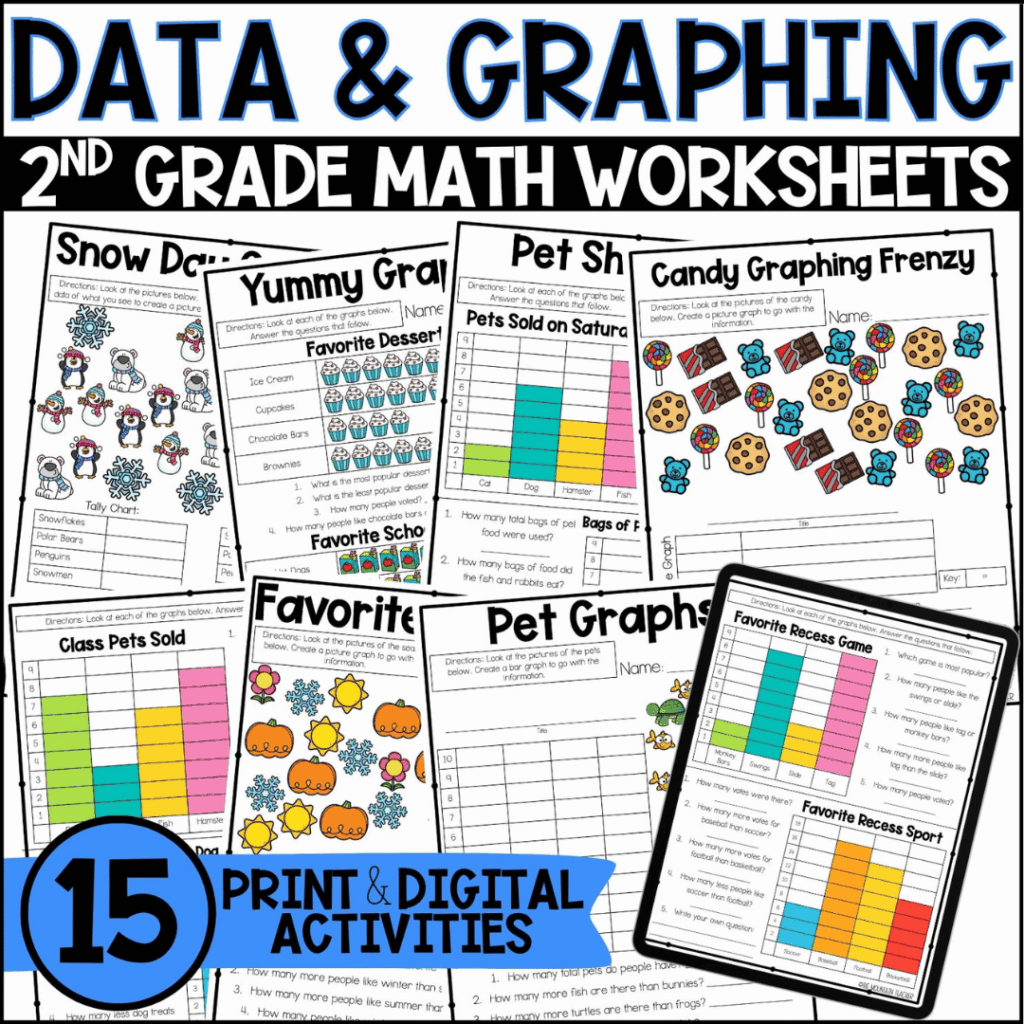
Instead of piecing together activities from multiple sources, you’ll have a complete graphing unit ready to go. If you’re ready to make graphing one of the easiest units to teach this year, grab the 2nd Grade Graphing Unit and start planning with confidence.
Want Your Entire Year of Math Planned Out Too?
If you love having a clear teaching guide, ready-to-use activities, assessments, and visual supports, the 2nd Grade Math Bundle takes that same approach across the entire school year. Inside the bundle you’ll find:
- 9 complete 2nd grade math units
- 40 weeks of math instruction
- Teaching guides for every unit
- Assessments and practice tests
- Weekly homework
- Anchor charts and posters
- Answer keys
- BOY, MOY, and EOY benchmark assessments
- A year-long scope and sequence
- Printable, Google Slides, and Easel formats
The bundle covers place value, addition and subtraction to 1000, word problems, data and graphing, measurement, geometry, money, time, and arrays.
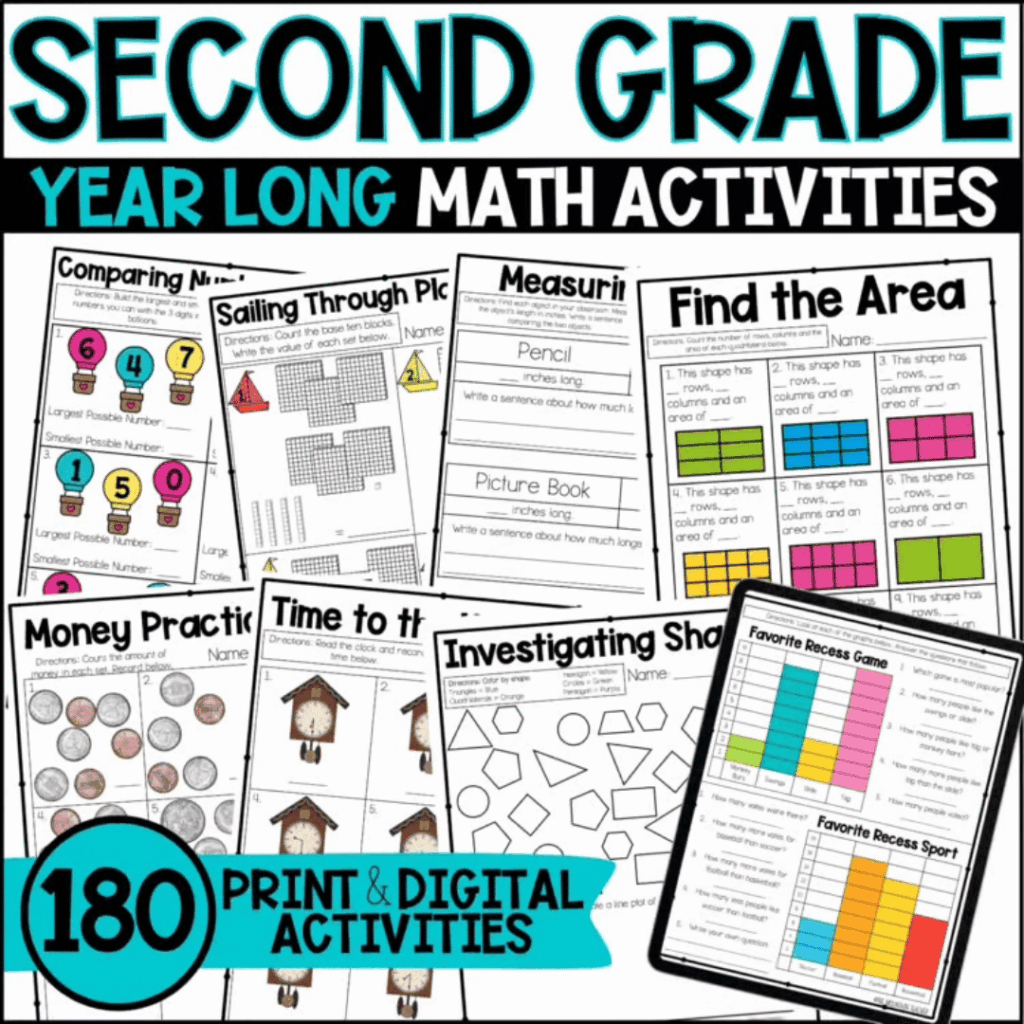
If you’re tired of planning one math unit at a time, the 2nd Grade Math Bundle gives you a complete roadmap for the entire year! Grab it today and save yourself hours of planning!
Looking for More?
Check out these posts next for more 2nd grade math ideas and teaching tips:
Save These 2nd Grade Graphing Ideas
Be sure to pin this post on Pinterest so you can easily come back to it when it’s time to plan your next graphing unit!