If graphing feels like one of those math units you piece together at the last minute, you’re not alone! A worksheet here, a quick bar graph there, maybe a survey if there’s time. First grade graphing activities can often end up feeling rushed or disconnected.
The good news is that graphing doesn’t have to feel stressful or scattered. With a clear plan and intentional pacing, you can teach data in a way that actually makes sense to first graders and helps you feel confident you’re meeting the standards. Let’s walk through these first grade graphing activities that will make your unit stress-free and fun!
Why First Grade Graphing Activities Feel Hard to Plan
Can we chat about why graphing is such a struggle for a minute? Graphing is different from many other math skills. Students aren’t just solving problems. They’re collecting data, organizing it, representing it, and answering questions about it.
That’s a lot of steps for six and seven-year-olds!
I remember the very first time I attempted to teach this topic, and my kids just stared back at me with the blankest expressions. I now realize I went about it all wrong and learned the hard way. Now, I’m sharing what I learned and how I changed my teaching so you don’t have to make those same mistakes!
Let’s make it simple. The bottom line is that when lessons aren’t aligned or skills are introduced too quickly, kids are going to struggle. For example, students may know how to color a bar graph but not understand what it represents. Teachers are left wondering if they’ve really taught the standard or just checked it off.
Have you ever felt this way? I know I have! But don’t worry, friends, I’ve got the answer: a strong graphing unit that builds skills gradually so students understand the why, not just the how. Ready to make it easier than ever? Let’s do this the right way!
Start With the Standard to Build Your First Grade Graphing Activities
If you want to make this as easy as possible for your students and feel confident you’re teaching what actually matters, start at the standard. I know, it sounds simple, but sometimes simple is what we need to be reminded of.
The first-grade data standard focuses on organizing, representing, and interpreting data with up to three categories. That means students need repeated practice collecting information, showing it in different ways, and talking about what the data tells them.
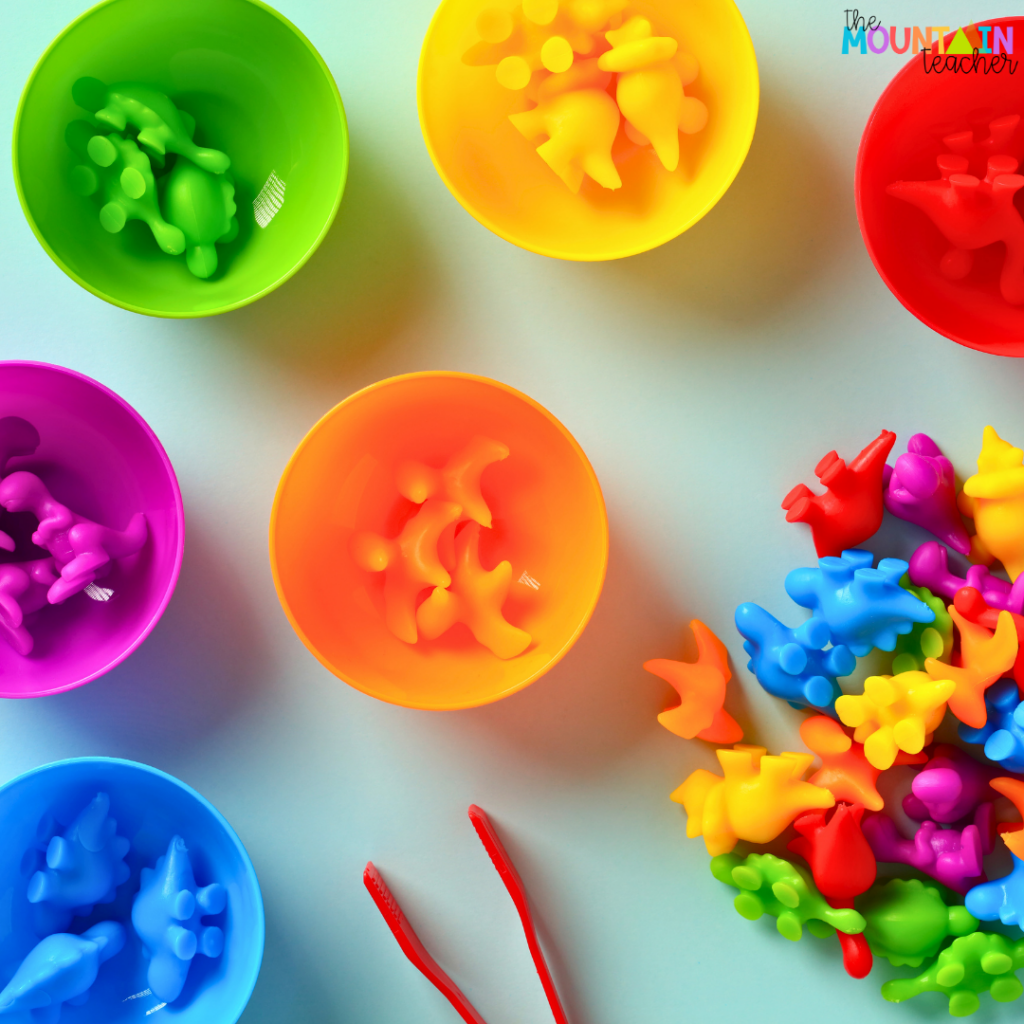
Instead of jumping straight to bar graphs, start with counting and sorting. Have students tally favorite colors, count classroom objects, or survey classmates about snacks or pets. These early lessons set the foundation for everything that comes later.
If you want a little more direction, I’ve made a clear teaching guide that helps here because it shows you exactly how to move from one skill to the next without guessing. In my First Grade Data and Graphing Unit, you will find this daily teaching guide that removes the need for planning and keeps you on track!
What This Looks Like in a Real Classroom
If you’re newer to teaching graphing, it helps to picture a simple progression of what this will look like in action. My personal teaching method goes like this:
- Introduce a new concept in a whole group format
- Teach the skill with visuals, examples, and discussion
- Ask questions to help students think through the new ideas
- Practice the skills with worksheets and learning activities
The whole group lessons are going to be the basis of everything you do, so make sure to spend the most time here. Here’s a look at each of the skills we focus on and some examples for how to teach them effectively.
Teaching Data Collection with Tally Marks
In the first few days, students might practice collecting data and creating tally charts together. You will want to model how to count carefully and mark tallies correctly.
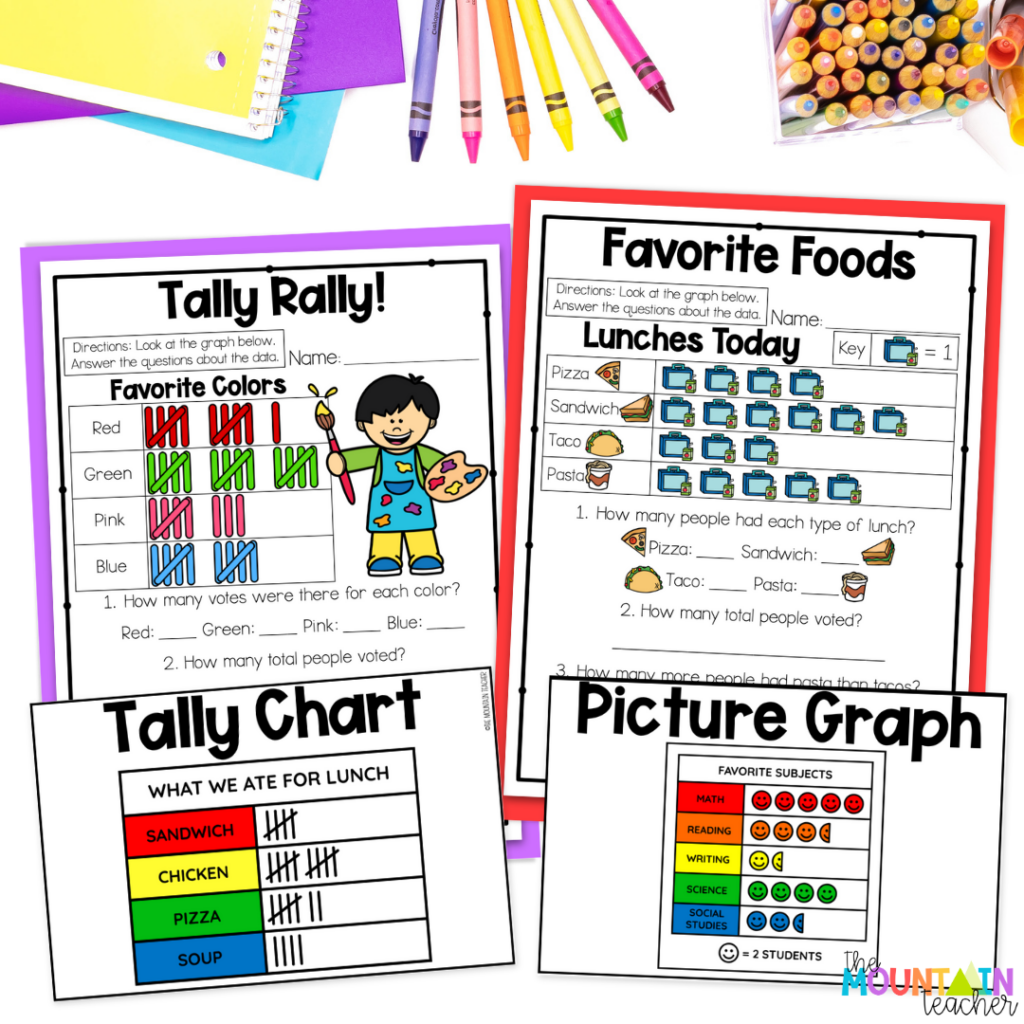
This can be something simple like saying aloud, “I’m going to ask each friend their favorite color. Every time someone says blue, I’m going to add one tally mark to the blue column. Watch how I stop at four and cross the fifth; this helps us count faster later.”
As I mentioned before, you can do this a few times with things like students’ favorite colors, pets, favorite snacks, and more. Choose fun topics like these to snag engagement and keep it as you teach data collection and tally marks.
Move Onto Picture Graphs
Next, that same data is represented as a number chart or picture graph. Students see that the information stays the same even though the graph looks different.
You can say something like, “We’re not changing our answers, just how we show them. For this favorite snacks chart, our tally says 6 friends chose apples, so our bar graph should also show 6. If it doesn’t match, that tells us we need to fix something.”
Create large picture graphs on the board, graphing the same simple items you tallied up. This progression is a great visual for helping students understand the different ways to show data collection. You’ll use this same approach to teach bar graphs and pie charts as well.
Interpreting Graphs
As the unit continues, students will move from data collection to interpretation. You will ask questions like how many more or less or which category has the most. The important thing to remember for this step is that modeling shows students how to think aloud before moving to independent work.
For example, you might say something like, “Before we answer, let’s look at the bars. Which one is the tallest? That tells us which group has the most. Now let’s count how many more, start at the shorter bar and count up.”
In the daily teaching guide, you will work through questions like these to interpret each type of graph you have learned about so far. This is the perfect pace for helping young learners truly grasp this topic!
Surveys and Polls
As a final step in this unit, students will also learn about polls and surveys. This is one of my personal favorite pieces in the unit, because the kids get to put everything they have learned into action! I like to do an example with the class first and ask just one simple question with just a few answer choices to keep this in line with the standards and make our graphs easy to read and interpret.
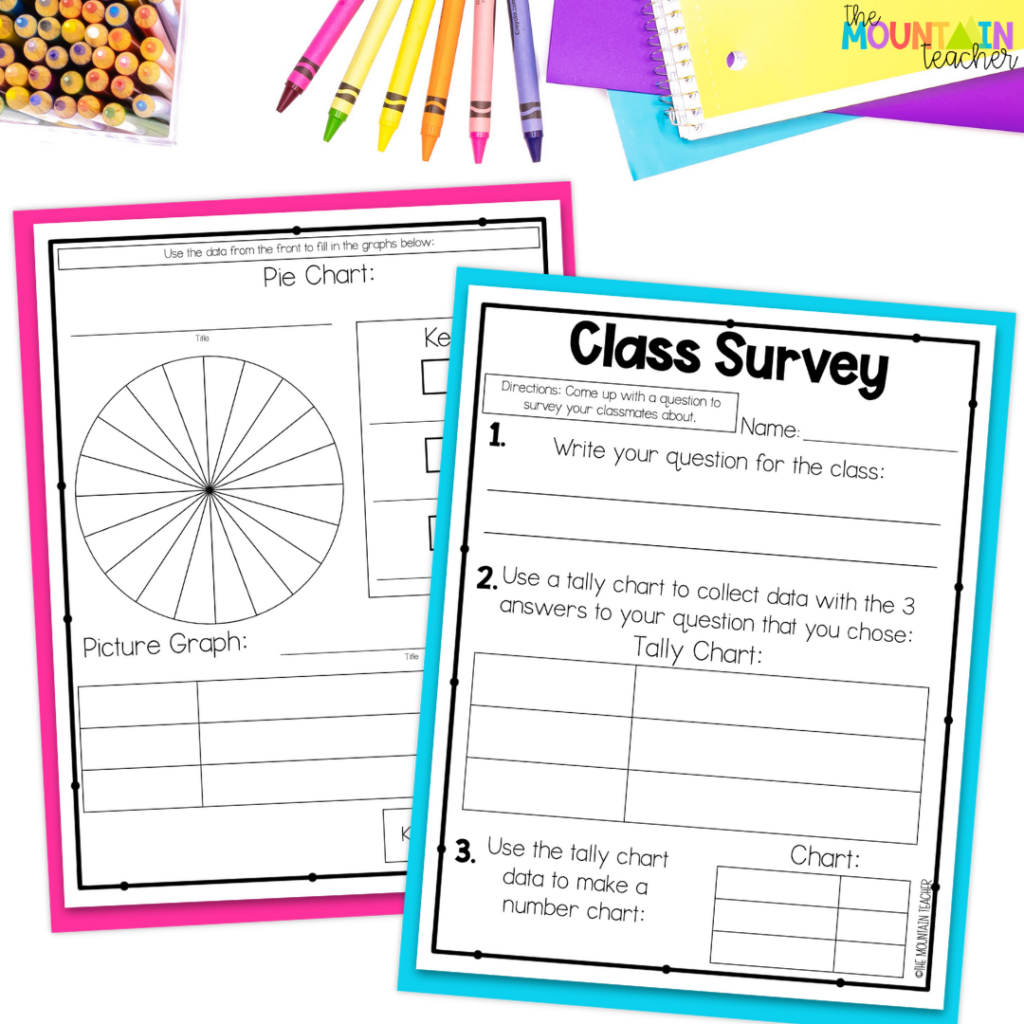
For example, you might ask students to share their favorite drink from a list like water, soda, milk, and juice. Allow each child to answer, tally the results, and then create a graph together to show the results. Afterward, ask questions like:
- How many votes were there for each drink?
- How many total people voted?
- How many more votes for soda than water?
- What was the least popular drink?
After you run through this process as a class, send your students off to take a poll on their own, or facilitate this in small groups. Then they can create a graph and answer similar questions as they go. This is a great way to finish up the unit and will give you a very clear understanding of how much your kids understand about this topic.
Tools and Worksheets for First Grade Graphing Activities
Aside from the hands-on, whole-group lessons that I mapped out above, you will want to include some visual supports and worksheets for follow-up. This will help your students get the opportunity to put what you’ve worked on into practice. Here’s a quick peek at what we use in my room.
Anchor Charts
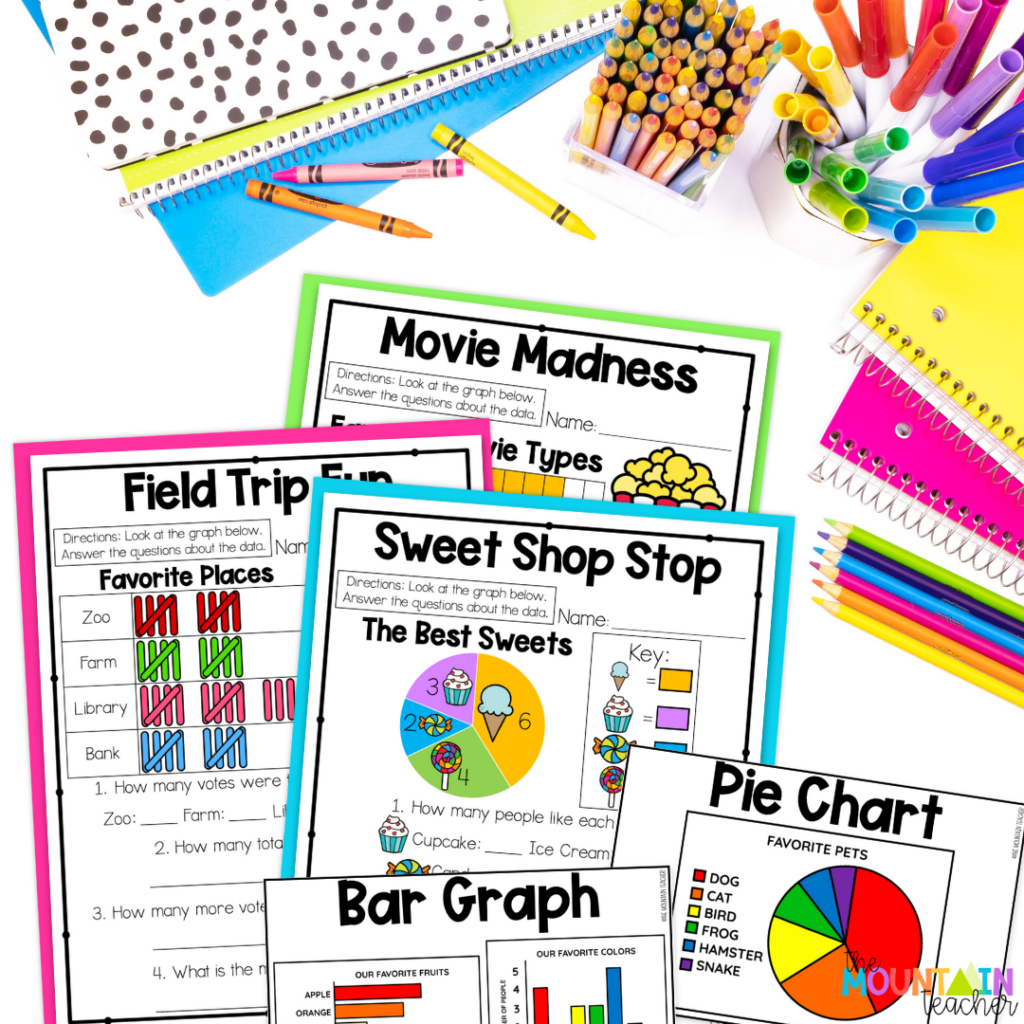
For each new type of graph that is presented, I use a colorful anchor chart as a visual support. These help your students grasp new vocabulary words and understand the differences between the data collection types. In my First Grade Data and Graphing Unit, there are 5 different anchor charts to help support your students.
Introduce these with your whole group lessons and then make sure to have them available in your math centers or displayed on a bulletin board for future reference.
Practice Worksheets
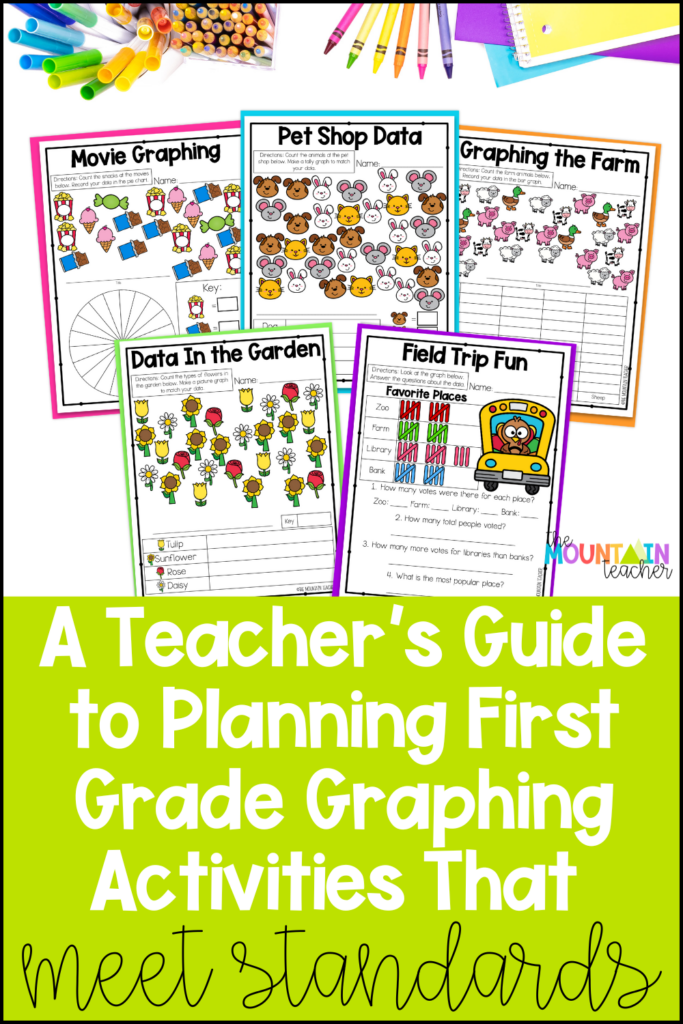
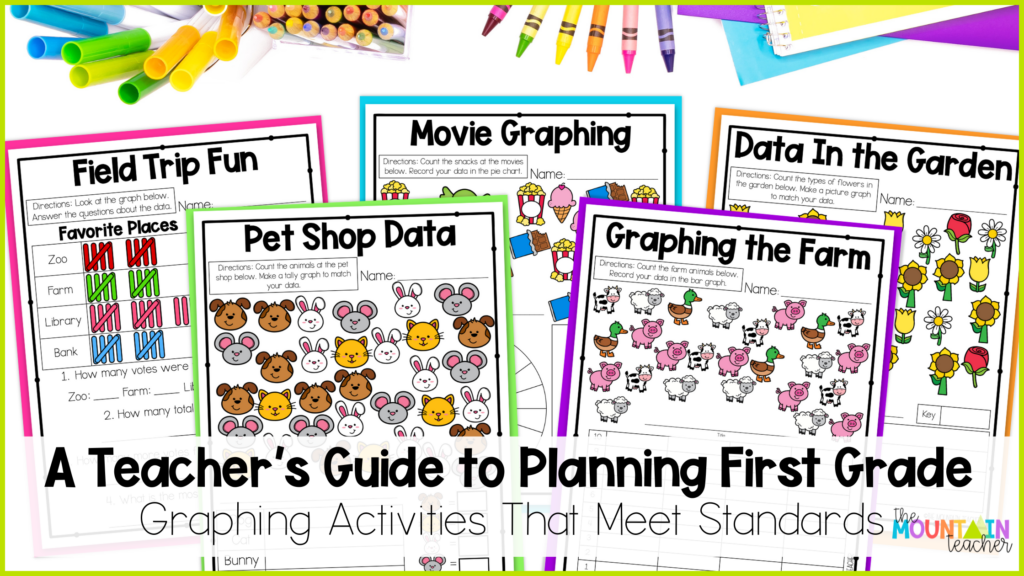
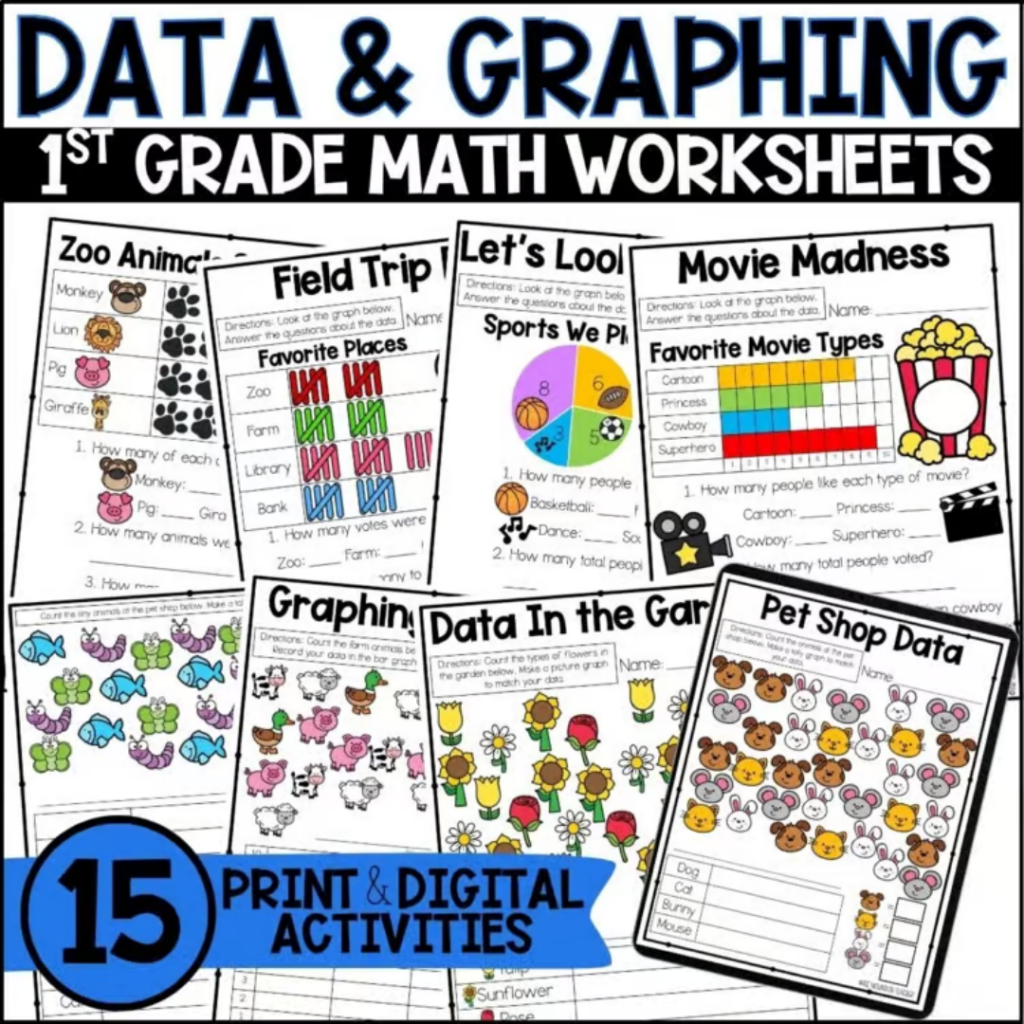
In addition to the visuals, you will also find engaging worksheets for each skill and topic. These worksheets encourage active learning with colorful pictures to count, sort, and graph, as well as class polling opportunities to get some real-life practice.
You can use the worksheets after your daily lesson to practice what was just taught. Don’t worry, the teaching guide tells you exactly which worksheets to use, so you won’t spend hours searching for the “right” activity to go along with each daily lesson.
Use Pre and Post Tests to Guide Instruction
Another essential part of using these first grade graphing activities is assessment along the way. You don’t want to wait until the end of the unit to test your kids’ understanding!
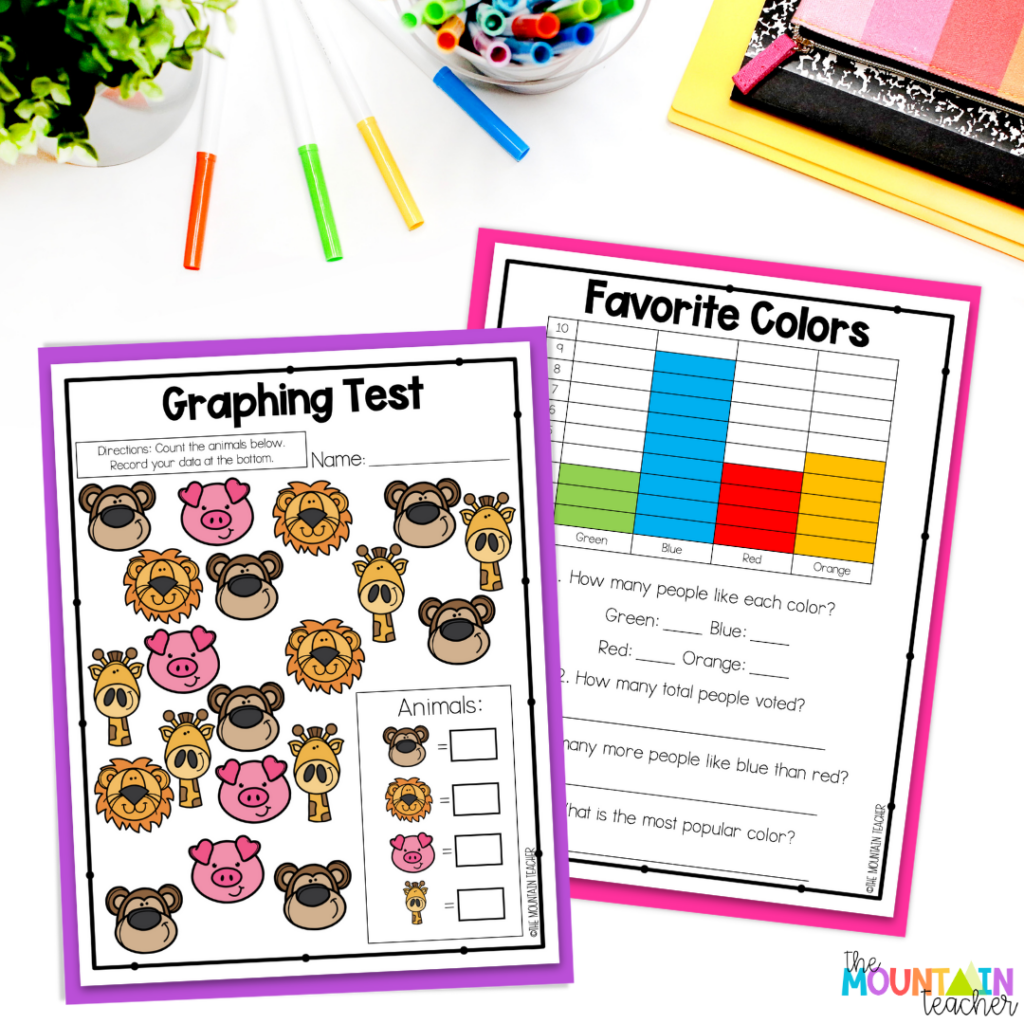
A pre-test at the beginning of your graphing unit gives you a clear starting point and takes the pressure off guessing where to begin. You might notice students can count data but struggle to interpret it, or that reading graphs feels harder than creating them.
That information helps you slow down where it matters most. At the end of the unit, a post-test shows growth and gives students a chance to see how far they’ve come. It also helps you feel confident that you’ve truly covered the standard.
When assessments are already aligned to your lessons, planning becomes much easier! In my daily teaching guide, you will see that I have included the pre- and post-tests as well as sprinkled in quizzes throughout the unit. This allows you to pause along the way and reassess your pacing to ensure everyone is getting the support they need to be successful.
Take the Stress Out of Planning First Grade Graphing Activities
Tired of piecing first grade graphing activities together? I get it! If you want a graphing unit that’s already aligned, paced, and ready to use, the First Grade Data and Graphing Unit is designed to take the stress out of teaching data and help it become one of the most engaging parts of your math block.
This three-week unit walks students through collecting data, creating graphs, and answering questions step by step. Everything builds logically, so skills don’t feel random or rushed.
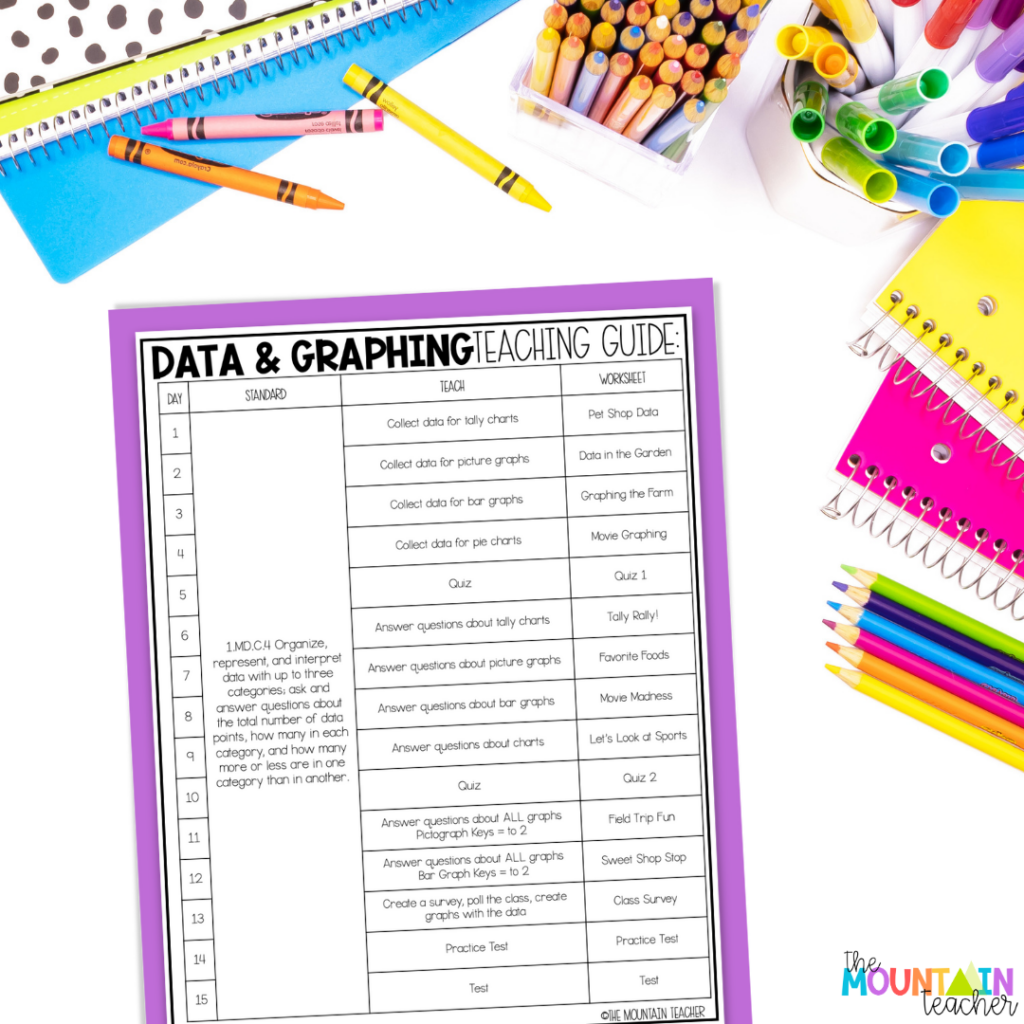
Inside the unit, you’ll find:
- A 15-day teaching guide
- 15 days of graphing worksheets and activities
- Anchor charts for each graph type
- Pre and post assessments
- Quizzes for progress checks
- Printable and digital options
- Standards-based instruction for all 3 weeks!
Because lessons are already sequenced, you can focus on teaching instead of searching for materials or wondering what comes next. Graphing does not have to feel like a gap in your math block. This unit gives you a clear plan and plenty of engaging first grade graphing activities you can start using right away!
If you want a ready-to-use plan that helps students truly understand data and graphs, the First Grade Data and Graphing Unit is exactly what you need! Not only will it give you the structure and support you’ve been looking for, but you can rest easy knowing you’re on par with the standards, and you won’t have those blank stares looking back at you when you’ve finished teaching! Head to TPT to grab your copy today!
Want This Level of Support for the Whole Year?
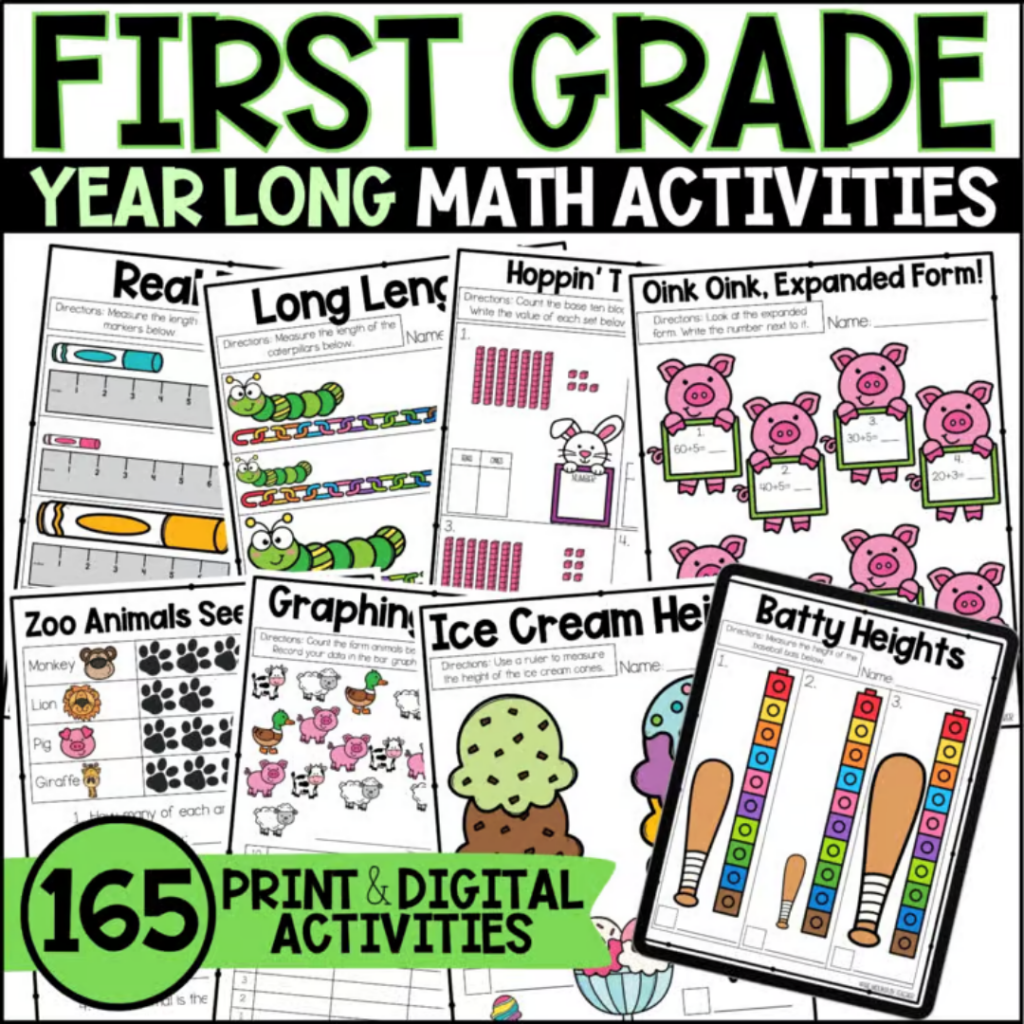
If you’re tired of planning math one unit at a time, the First Grade Math Bundle takes the same low-prep, standards-aligned approach and applies it across the entire year.
Instead of piecing things together, you get consistent routines, teaching guides, and assessments for every major math standard. That consistency helps students know what to expect and helps you feel organized and prepared.
The bundle includes 8 complete math units, teaching guides and pacing support, quizzes, tests, and practice assessments, anchor charts for every unit, and printable and digital formats. It’s especially helpful if you want math planning to feel calmer and more predictable throughout the whole year!
Looking for More?
Check out these posts next for more helpful tips to teach primary math topics!
- Setting Up Practical Math Centers that Show Results
- Everything You Need to Easily Teach Data and Graphing
Save These First Grade Graphing Activities
Be sure to pin this post on Pinterest so that you can come back to it when you’re ready to start planning your first grade graphing activities!